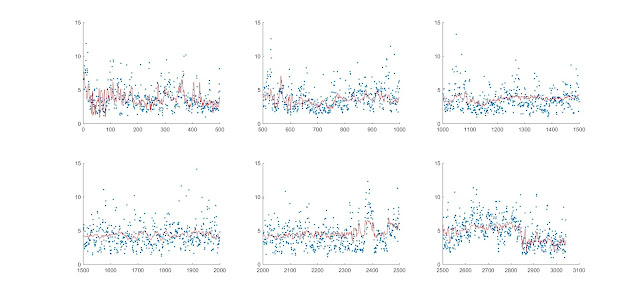
Today, I selected one higher peak from two peaks at every depth and accumulate them to build a new output data matrix. As a result, the ANN model performs better than before.
Summary:
The followings are the comparisons of predicting alpha, miu and sigma one by one with three different ANN models and predicting them together with one comprehensive ANN model.
1. alpha
The first is alpha, namely the magnitude of the peak. The first modeling result is from one comprehensive ANN model while the second modeling result is from one model specially built for alpha. It is very obvious that the second one shows better modeling results. So I think we should predict 3 parameters (and later 6 parameters) one by one with different ANN models.
The third is R value for predicting alpha with one major peak. It improves from about 0.5-0.6 to 0.7-0.8 than two peaks.
2. miu
The second is miu, namely the mean location of the peak. The first modeling result is from one comprehensive ANN model while the second modeling result is from one model specially built for miu. These two show similar predicting results.
The third is R value for predicting miu with one major peak. It improves from about 0.5-0.6 to 0.6-0.7 than two peaks.
3. sigma
The third is sigma, namely the deviation of the peak. The first modeling result is from one comprehensive ANN model while the second modeling result is from one model specially built for sigma. These two show similar predicting results. The second one also shows better modeling results.
The third is R value for predicting sigma with one major peak. It improves little than two peaks.
In conclusion:
1. if we select the bigger peak from two peaks and predict it at every depth, it will show better predicting results.
2. if we predict 3 or 6 parameters one by one (predict one parameter at one time, build 3 or 6 ANN models in total), the accuracy of prediction will improve than predicting all parameters at one time (just build one ANN model).
Tomorrow, I will try to improve the accuracy of prediction more.


in six different plots such that each represent a 500 ft section, generate the predicted t2 distribution vs actual t2 distribution for 10 randomly sampled depths.
ReplyDeleteAlso plot overall R2 in the t2 distribution prediction for each depth.
Ok, but the prediction is not good enough now. And for now we just consider the bigger peak among two peaks. So the R2 for every depth should be low.
DeleteAlso plot overall R2 in the t2 distribution prediction for each depth in six plots... each plot representing 500 ft section
ReplyDeletegood to see that you are getting better match
ReplyDeleteThank you. Maybe we should improve the prediction more.
Delete