Summary:
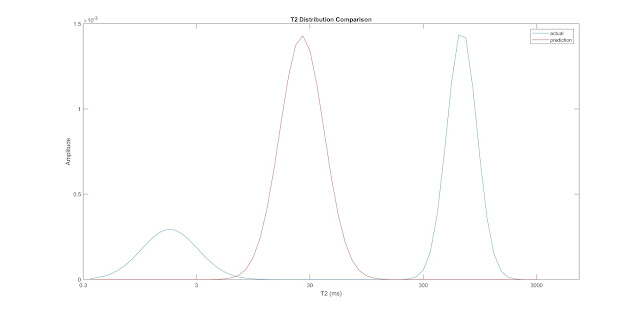
The following are 10 comparison plots. They are selected from 3042 depths of 100th, 200th, 300th, ... , 1000th.
The following is the R2 distribution figure. I just plotted R2 which are from -1 to 1. there are about 1000 depth whose R2 are smaller than -1, some of them are very small (down to -1000) so that I could not put them in one histogram. It is very randomly distributed. There are not many depths whose R2 are close to 1.
The following are figures for biggest peak at every depth.
The first is the alpha and its R value.
The second is the miu and its R value.
The third is the sigma and its R value.
They all perform better than two peaks. But they are still not good enough.
Tomorrow, I will try to select new logging data to improve ANN model prediction performance.


No comments:
Post a Comment